When we started at GroundHog, our expertise was firmly rooted in software development for mining companies. Our flagship product was (and remains) our Short Interval Control and Fleet Management System, a tool primarily utilized by Operations Teams at mines. However, as our journey unfolded, we increasingly engaged with the Maintenance teams at various mining sites.
Around 2019, our conversations with these teams began to focus on a recurring theme: telemetry data. Maintenance teams consistently asked if we could develop a way to read and utilize telemetry data. Despite numerous false starts and trials over the years (our core team being predominantly software experts), we’ve made significant progress recently. This leap forward is largely thanks to collaborating with individuals with deep hardware and firmware expertise, particularly in the CAN protocol and the J1939 standard.
In the past few years (2023 & 2024), we’ve solidified agreements with numerous Original Equipment Manufacturers (OEMs) serving the Mining and Construction markets. Additionally, we’ve partnered with various aftermarket sensor manufacturers and data logger specialists to address specific use cases. Our approach mirrors the iconic Microsoft-Intel partnership of the 80s and 90s—Microsoft focused on software while Intel concentrated on hardware, ensuring customers received the best of both worlds.
At GroundHog, we are passionately committed to digitizing every mine globally. As part of this mission, we believe in sharing our knowledge and insights to accelerate industry-wide innovation.
Diagnostic Ports in Heavy Equipment for Maintenance and Operations
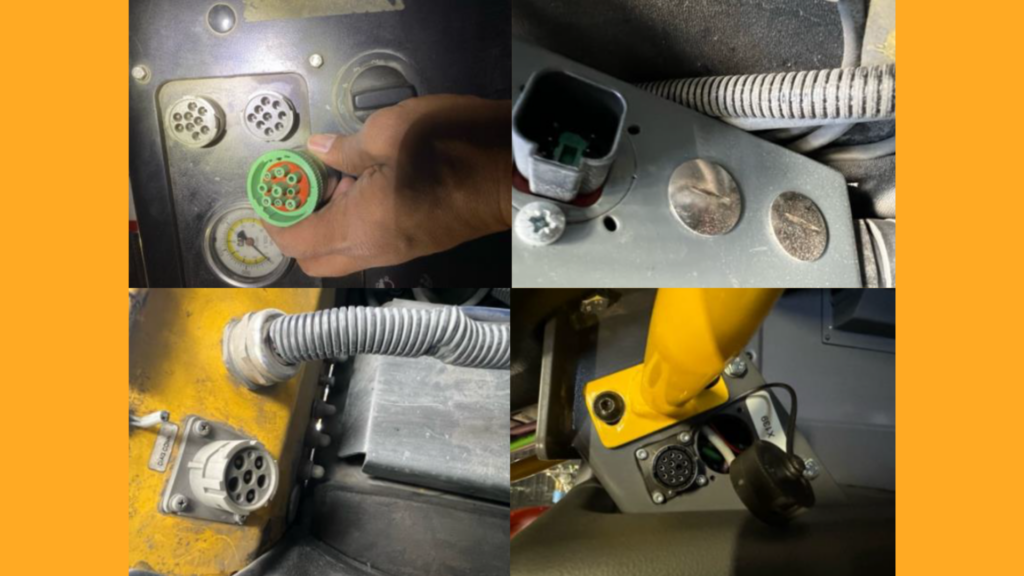
The diagnostic port in heavy equipment is used primarily by Maintenance to perform various maintenance and diagnostic tasks. For certain makes and models, the Diagnostics port also has information on Payload, Trips Counts, etc. A diagnostic port generally looks like the following:

Please note that these ports come in various shapes and sizes depending on the Engine manufacturer (and not necessarily the Equipment Manufacturer)
Most OEMs now comply with the j1939 standard for tools used for Heavy Equipment diagnostics, specifically any equipment that uses a Diesel Engine. Light Vehicles that use Petrol (Gasoline) engines have been standardized on the OBD-II standard. Caterpillar, Komatsu, and Epiroc were some of the first OEMs to adopt the CAN Open Standard, a superset of the j1939 standard) for all Telemetry and Diagnostics data, and for providing access to the equipment’s Electronic Control Units (ECUs) and onboard diagnostics systems. This data helps maintenance teams manage the health and performance of the equipment, ensuring it stays reliable, efficient, and safe. This interface supports a proactive, data-driven approach to equipment maintenance, which is key to modern practices. Here is how this data is used:
1. Retrieving Diagnostic Trouble Codes (DTCs)
Technicians use the diagnostic port to connect diagnostic tools or scan tools to retrieve Diagnostic Trouble Codes (DTCs). These codes indicate specific faults or issues within the equipment’s systems. By reading these codes, maintenance staff can identify problems like sensor failures, engine issues, or electrical faults, allowing for quick and targeted repairs.
2. Monitoring Equipment Parameters
The diagnostic port provides access to real-time data from various sensors and control modules. Technicians can monitor vital parameters such as engine speed, temperature, and fuel pressure. This real-time monitoring helps assess the equipment’s performance, diagnose intermittent issues, and confirm that repairs have been successful.
3. Updating and Reprogramming Software
Maintenance personnel can use the diagnostic port to upload new software or firmware updates to the equipment’s ECUs. They can also reprogram settings and calibrations as needed. Keeping the software up to-date ensures the equipment runs smoothly, meets regulatory standards, and resolves any software-related problems.
4. Generating Health and Status Reports
Diagnostic tools connected to the port can generate detailed health and status reports. These reports give a comprehensive overview of the equipment’s condition, helping to spot potential issues early and avoid major breakdowns or expensive repairs.
5. Logging and Analyzing Data
The diagnostic port allows for the collection of operational data over time. This data can be analyzed to identify trends, predict failures, and optimize maintenance schedules. By analyzing this data, maintenance teams can enhance the reliability and longevity of the equipment.
6. Calibrating and Configuring Systems
Technicians can use the diagnostic port to perform calibrations and configure system parameters. Proper calibration and configuration ensure that the equipment operates within the desired tolerances and performance standards, maintaining accuracy and efficiency.
J1939, SPNs and PGNs
When working with the J1939 specifications in heavy equipment and industrial applications, you’ll often come across two important terms: SPN and PGN. Understanding both SPNs and PGNs is crucial for interpreting J1939 messages. SPNs help you identify and understand specific pieces of data, while PGNs ensure that this data is organized and transmitted in a consistent and deterministic pattern. By knowing the role of each, you can effectively decode and use the information provided by the J1939 protocol, making it easier to maintain and troubleshoot heavy equipment. Let’s break down what these terms mean and how they differ.
SPN (Suspect Parameter Number)
SPN stands for Suspect Parameter Number. Think of an SPN as a unique identifier for a specific piece of data or parameter within a message. It tells you exactly what kind of information you’re looking at.
An SPN is a unique code assigned to a specific parameter. This could be anything from engine speed to oil pressure or temperature.
SPNs are used to identify individual pieces of data within a message, making it easier to understand what each part of the message is about.
For Example, SPN 190 represents the Engine Speed parameter. So, whenever you see SPN 190, you know it refers to the engine speed data
PGN (Parameter Group Number)
PGN stands for Parameter Group Number. A PGN is a unique identifier for a group of related parameters that are sent together in one message. A PGN is a code that defines a collection of related parameters. It describes the structure and content of the message, specifying which SPNs are included and how they are arranged.
A PGN is used to organize related data points into groups, ensuring that information is transmitted in a standardized way. This helps different systems and devices interpret the data consistently.
For Example, PGN 61444 is often used for engine data. This might include SPNs for engine speed, fuel rate, and other related parameters. Whenever you see PGN 61444, you know the message contains these specific types of data.
Key Differences between an SPN and a PGN
SPNs focus on individual parameters, while PGNs deal with groups of parameters. SPNs tell you what specific data is being conveyed, whereas PGNs define how data is organized and transmitted. SPNs are detailed, focusing on single data points. On the other hand, PGNs are broader, encompassing multiple related data points within a single message.
