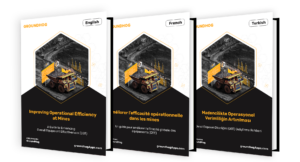
Improving Operational Efficiency at Mines French.
Dans cet eBook, nous explorons comment l’industrie minière a évolué
Transform your mining data into actionable insights with powerful, customizable dashboards designed to optimize performance and enhance decision-making
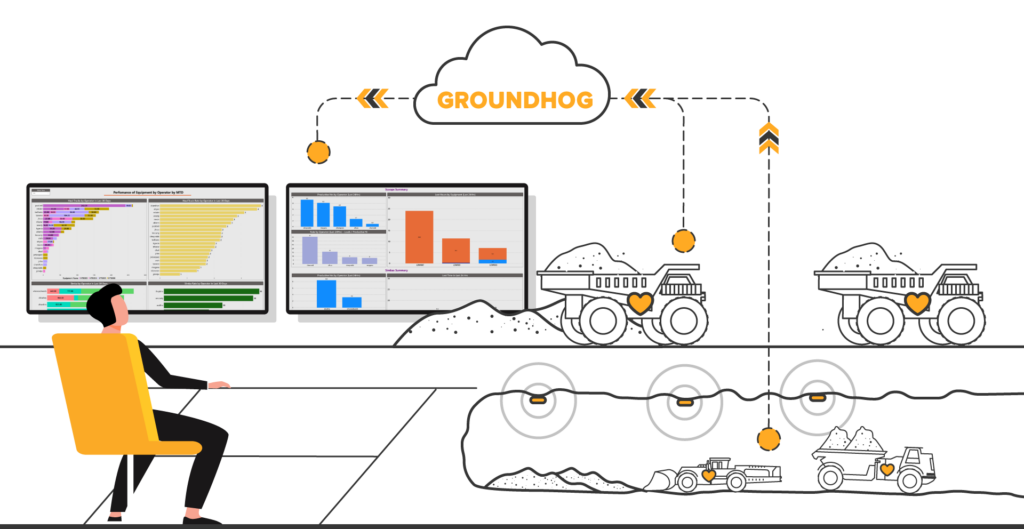
Seamless integration of Groundhog FMS with Power BI dashboards
GroundHog FMS provides powerful integration with Microsoft Power BI, allowing you to create dynamic and interactive dashboards that give you real-time insights into every aspect of your mining operations. From production data to maintenance metrics, visualize and analyze your data in one place to drive informed decision-making.
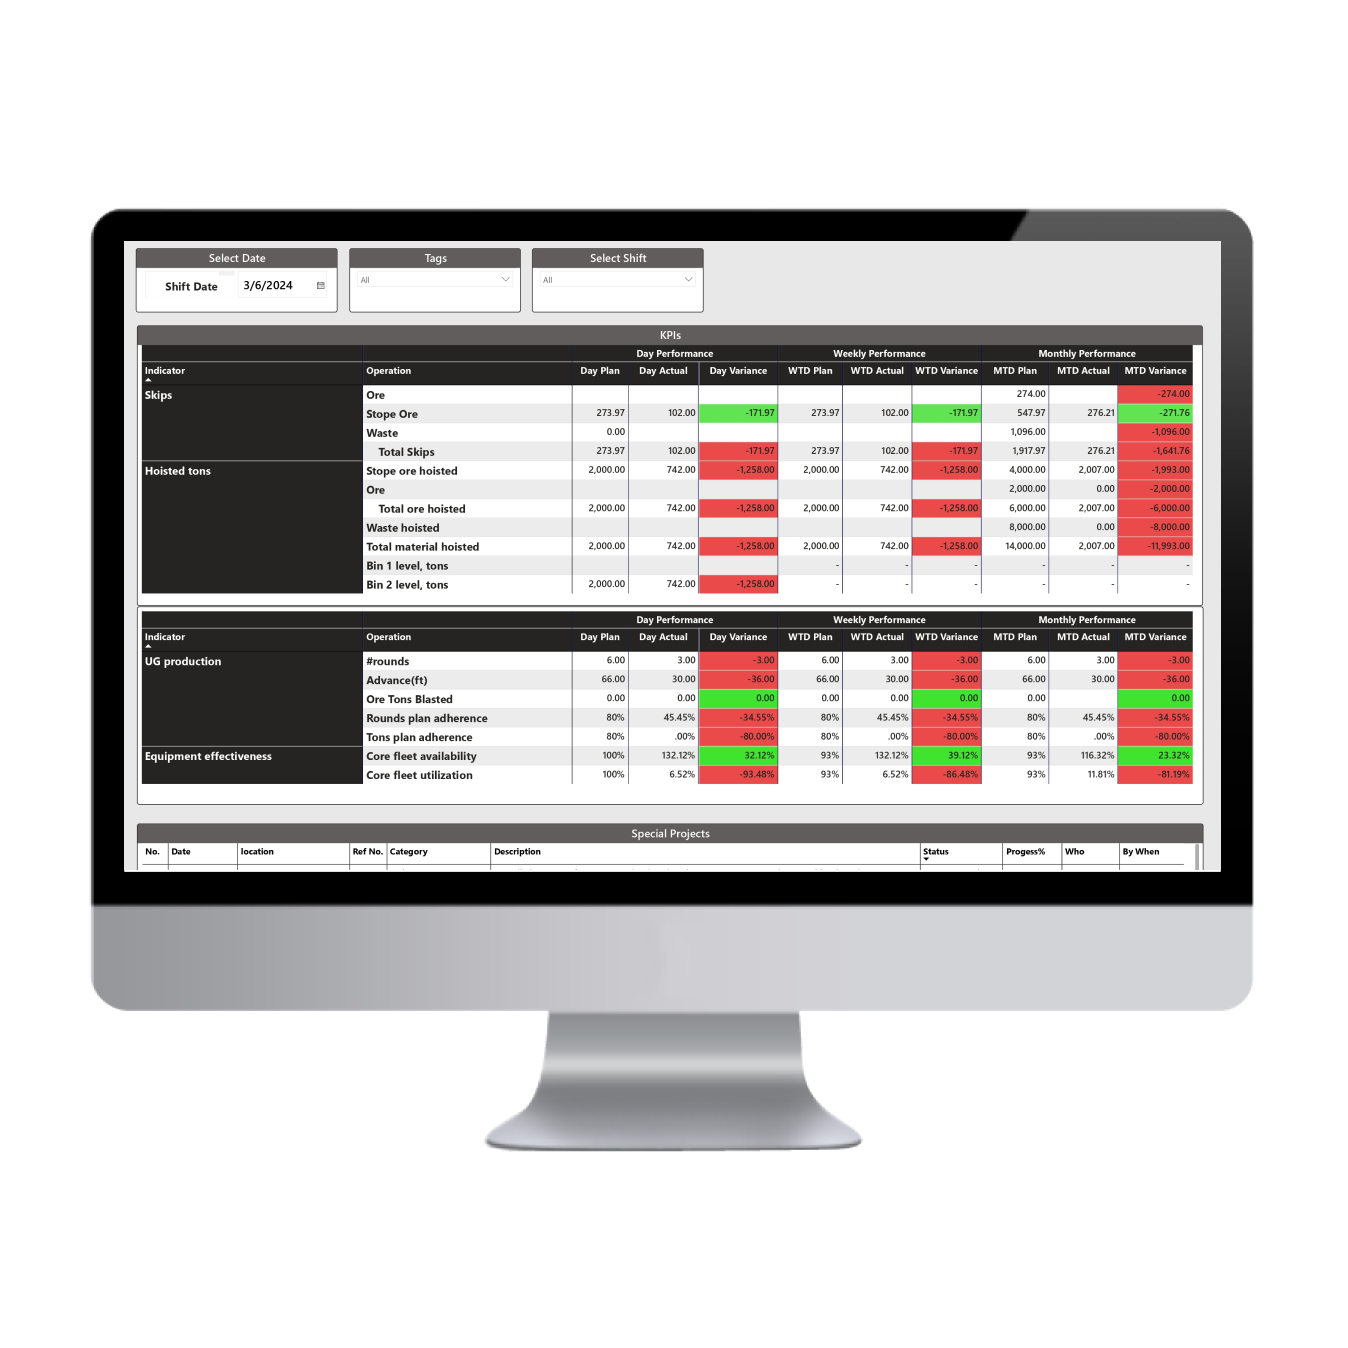
Optimize Operations with Live Data
GroundHog’s dashboards provide real-time visibility into mining activities, helping you monitor and improve performance across your operation.
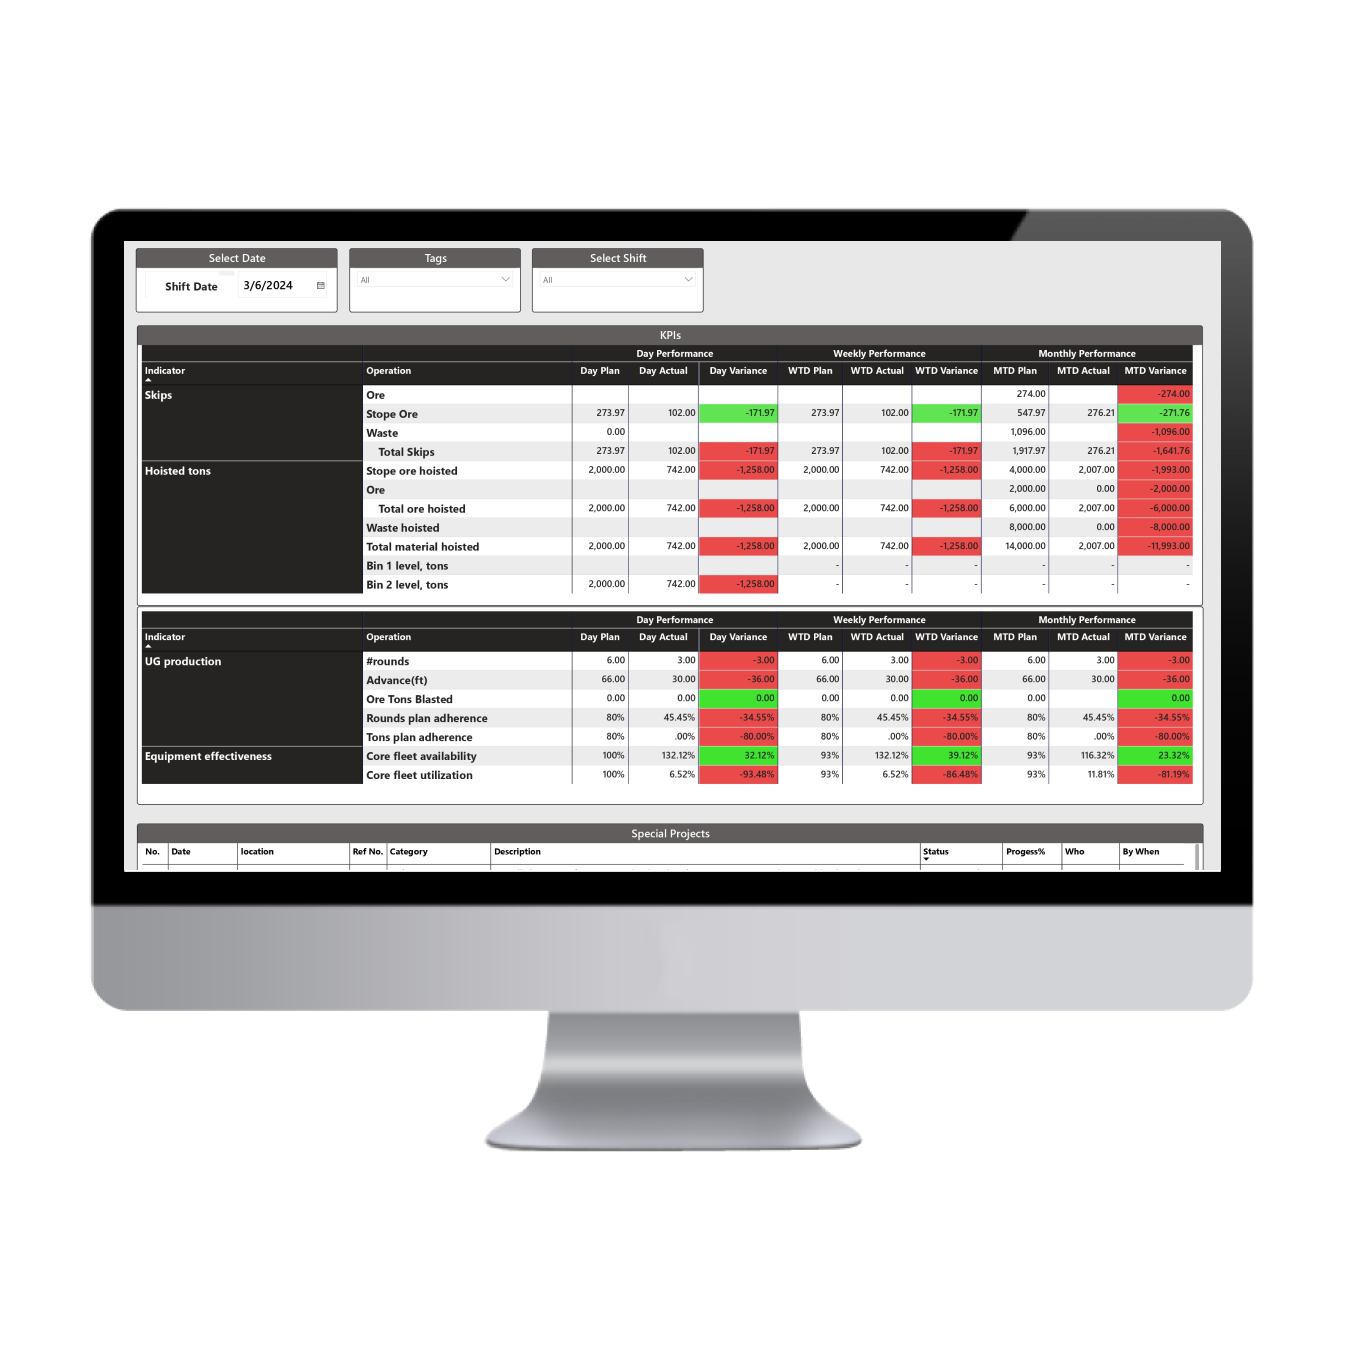
Improve Efficiency with Visualized Data
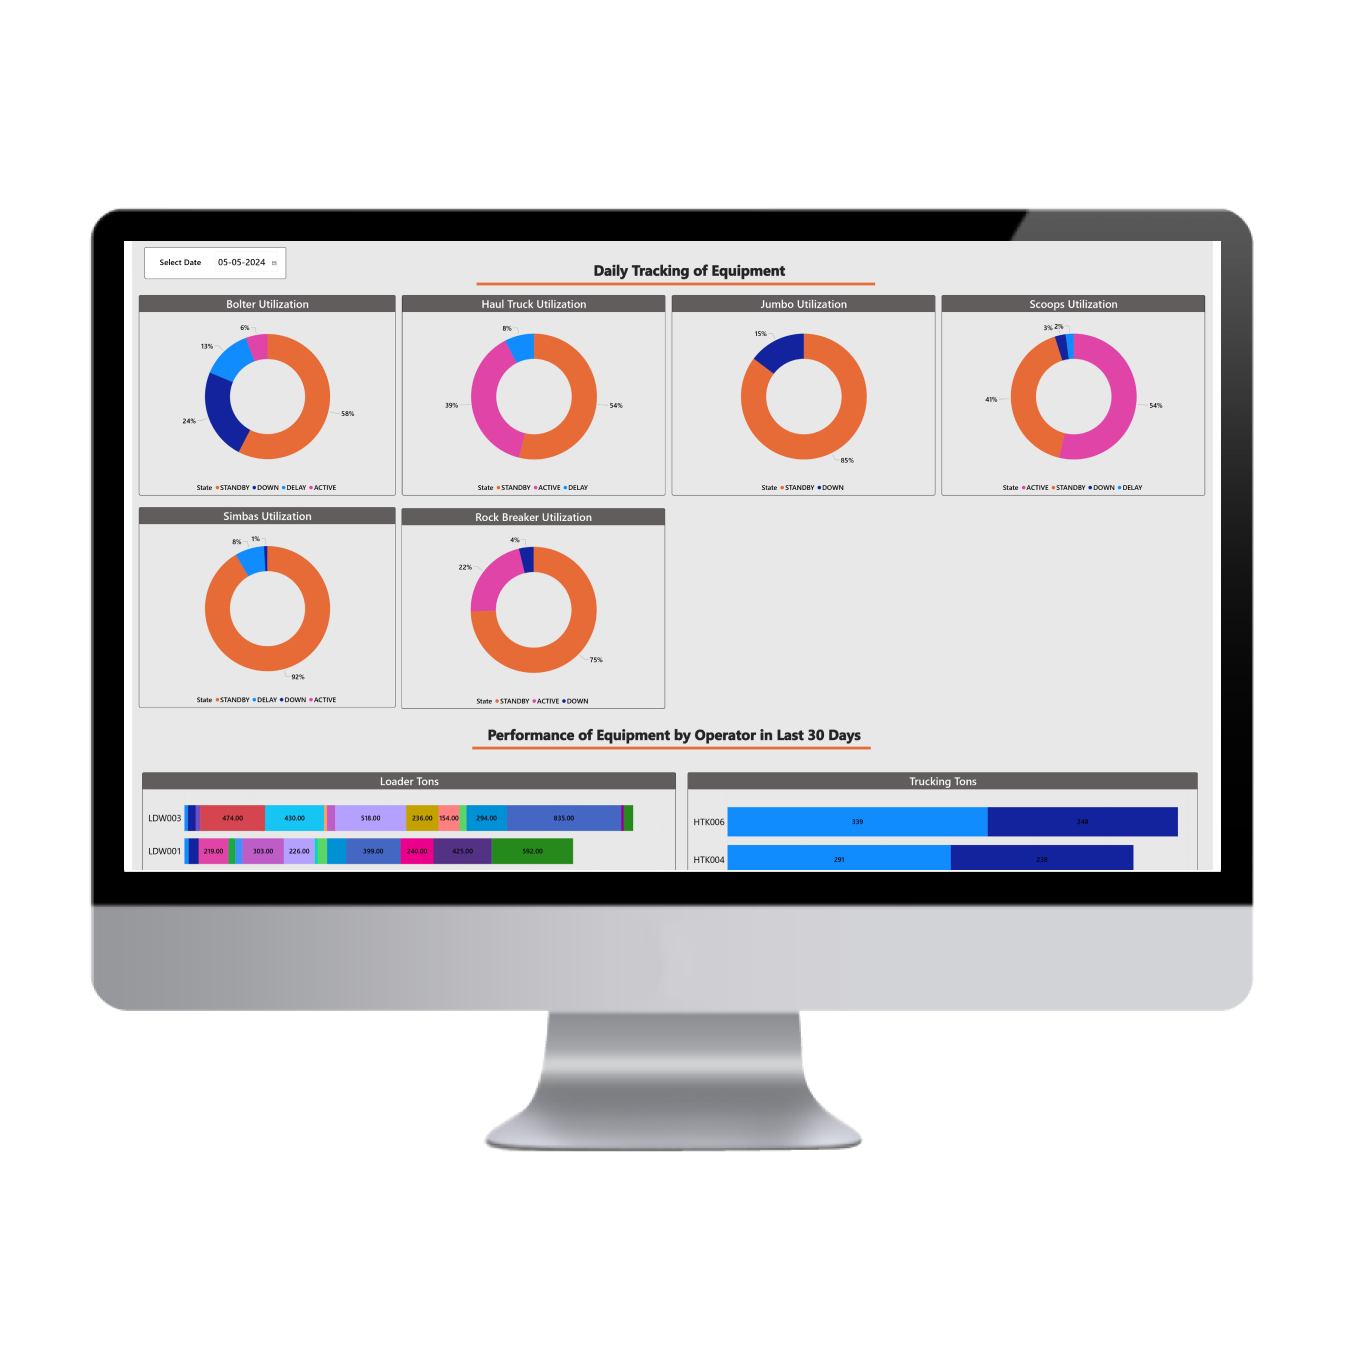
Use GroundHog’s data visualization tools to gain deeper insights into equipment usage and operational performance.
Iterate, rinse and repeat with Power BI Mining Dashboards built by GroundHog

Dans cet eBook, nous explorons comment l’industrie minière a évolué

Bu eKitapta, madencilik sektörünün dijitalleşme ve otomasyonun yükselişiyle nasıl dönüştüğünü,
Bu e-Kitapta, bakım departmanınızı kuruluşunuz için stratejik bir varlığa dönüştürerek
GroundHog’s Mining Dashboards powered by Microsoft Power BI provide real-time, customizable insights into your mining operations. They allow you to visualize and analyze data across different functions, from production to safety, helping you make informed decisions quickly and efficiently.
The Power BI integration enhances mining operations by offering data visualization in an easy-to-use format. It allows users to connect data from various sources, monitor real-time production, and create customizable reports that help track KPIs and operational performance, leading to optimized decision-making and improved productivity.
With GroundHog’s Mining Dashboards, you can visualize data related to production, equipment health, safety, maintenance, and more. The dashboards offer a comprehensive overview of your operation, enabling you to track performance, detect issues, and drive operational improvements.
Yes, GroundHog’s Mining Dashboards are fully customizable. You can tailor the dashboards to specific roles within your organization, ensuring that each team member has access to the data they need to make informed decisions in real-time.
Data from GroundHog’s Fleet Management System (FMS) seamlessly integrates into Power BI through secure, automated data pipelines. This enables you to pull real-time data from your mining operations directly into Power BI, where it can be visualized and analyzed in customizable dashboards.
GroundHog ensures that all data integrated into Power BI follows strict security protocols. This includes secure data handling, compliance with industry standards, and end-to-end encryption, ensuring that your operational data remains safe and protected at all times.
Yes, GroundHog’s Mining Dashboards can incorporate predictive analytics by leveraging historical and real-time data to identify patterns and predict future performance or maintenance needs. This helps improve operational planning and prevent unexpected downtime.
Find out how GroundHog can help your operations with a demo tailored to your needs. Our team will show you how our platform works and answer any questions you have.
Why Request a Demo?
We look forward to showing you how GroundHog works. If you have questions before scheduling, contact us at getStuffDone@groundhogapps.com