Most OEMs provide tools to connect to and read data from the equipmentʼs Diagnostics Ports. Common ones that directly connect to the machine using Laptop, or in the cloud are:
- Caterpillar: CAT VIMS Supervisor, VisionLink
- Komatsu: Inline 6, Komtrax
- Epiroc: Certiq
- Sandvik: FQM, OptiMine
- Cross-OEM: Texa, Jaltest, Diesel Laptops, ANCEL, etc.
Diagnostics data can also be recorded, saved, and transmitted using Data Loggers. Examples of really good and comprehensive data loggers are CAN Edge, Bluefire, Newtrax, Senquip, etc. These data loggers have ports to capture, interpret and store the data on a local storage unit ( an SD card, or a local SDD storage), and then use WiFi or Cellular connectivity to send the telemetry data to the cloud.
You can also build your own CAN Data loggers using a combination of a CAN-to-Ethernet or CAN-to-WiFi hardware unit connected to a tablet or computer. While very cost effective, these systems are great for DIY projects, but are not really commercial grade.
Exploring CAN Data Loggers
A CAN data logger is used to monitor, record, and analyze data from the Controller Area Network (CAN) bus of vehicles and heavy equipment. Think of it as a digital recorder for your equipment’s electronic systems, capturing all the important information that keeps your machinery running smoothly.
A CAN data logger connects to the CAN bus, where it listens to all the communication happening between different electronic control units
(ECUs) in the vehicle or equipment. These ECUs might control things like the engine, transmission, brakes, and other critical systems.
The logger captures and stores this data continuously or at specific intervals, depending on how you set it up. This recorded data includes various parameters such as engine speed, temperature, fuel consumption, and more.
After recording, you can transfer the data to a computer or a mobile device for analysis. The loggerʼs software helps you visualize the data, generate reports, and spot any anomalies or issues that might need attention.
A Closer Look at Data from the Data Logger
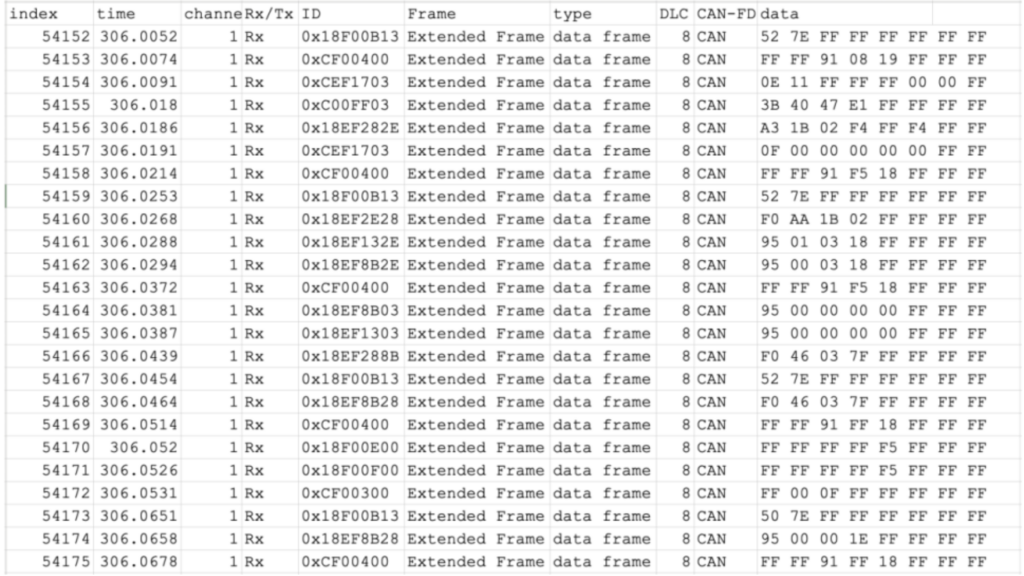
The following image shows you what raw data from the Diagnostic Port looks like. As you will see, most of the data is published on the CAN Bus. When you look closely, based on the machine type (mainly, Engine type), you will see that certain parameters are not published on the bus. Youʼd have to query the Engine to provide that information. For example, the Engine ID is typically not published on the bus. Youʼll need to Send a message and process the response. Systems like GroundHog ensure that you can safely get all the data you need through Telemetry from all makes and models of heavy equipment.

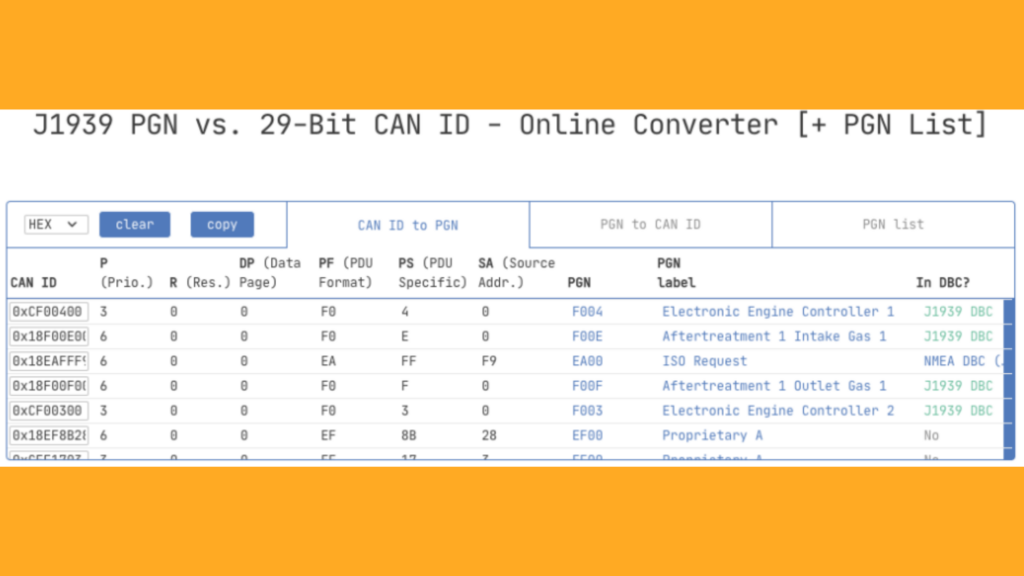
There are many online tools you can use to convert this data stream to human-readable data. An example is here (on the CSS Electronics website)

Interpreted Data from the CAN Data stream
The following data was taken from a Caterpillar 777E haul Truck (yes, it is a lot of data – please zoom in to see the actual values). This haul truck was not moving when the data was recorded.

Specific Data from a Caterpillar Machine
Please note that this sample was taken from equipment different from the above.
- “EngineSpeed”: 747.375,
- “EngineTotalHoursofOperation”: 2836.6000000000004,
- “EngineTotalRevolutions”: 12507000,
- “TotalPowerTakeoffHours”: 4.800000000000001,
- “EngineTotalIdleFuelUsed”: 1250.0,
- “EngineTotalIdleHours”: 788.1,
- “EngineFuelDeliveryPressure”: 1020,
- “EngnExtnddCrnksBlwPrssr”: 12.75,
- “EngineOilLevel”: 102.0,
- “EngineOilPressure1”: 284,
- “EngineCrankcasePressure1”: 0.5546875,
- “EngineCoolantPressure1”: 510,
- “EngineCoolantLevel1”: 100.0,
- “EngineFuelRate”: 5.300000000000001,
- “EngineAverageFuelEconomy”: 2.888671875,
- “WheelBasedVehicleSpeed”: 0.0,
- “TripDistance”: 138984.875,
- “TotalVehicleDistance”: 138983.75,
- “EngineCoolantTemperature”: 29,
- “EngineFuel1Temperature1”: 215,
- “EngineOilTemperature1”: 1774.96875,
- “EngnTrhrgr1OlTmprtr”: 1774.96875,
- “EngineIntercoolerTemperature”: 215,
- “EngnChrgArClrThrmsttOpnng”: 102.0
