Connect to Mine Performance Dashboard in Power BI Desktop
The application contains Power BI reports, the data will be pulled based on the user logs in.
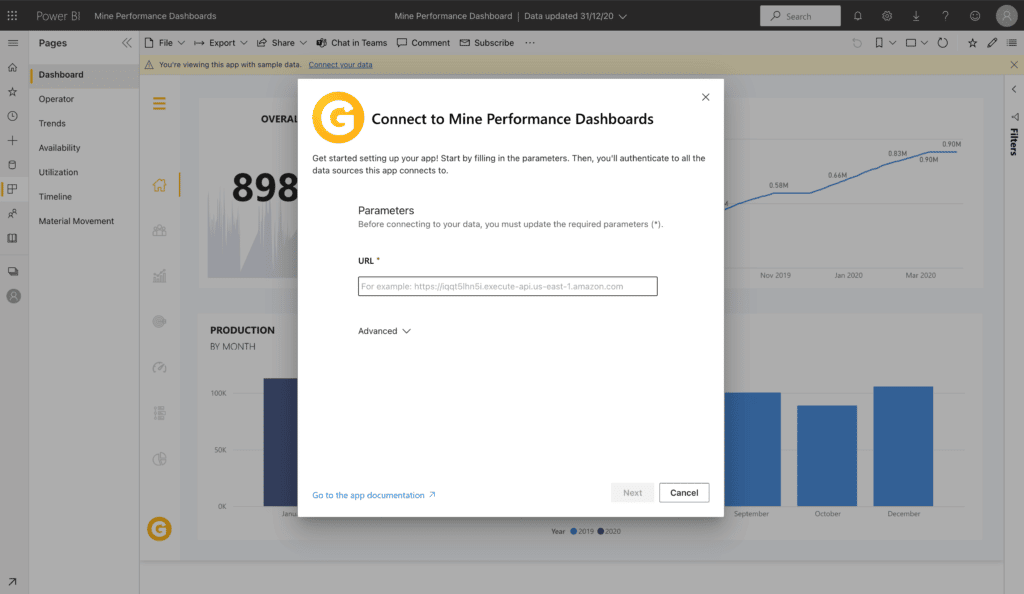
The application is designed in such a way that each of our customer will be provided with separate data URL with unique credentials. When the install the application, first step is to provide the URL and credentials so that the reports will then be pulling the data from those URL validating with the credentials provided.

To connect to Mine Performance Dashboards, select Mine Performance Dashboards application from the Power BI Desktop app store.
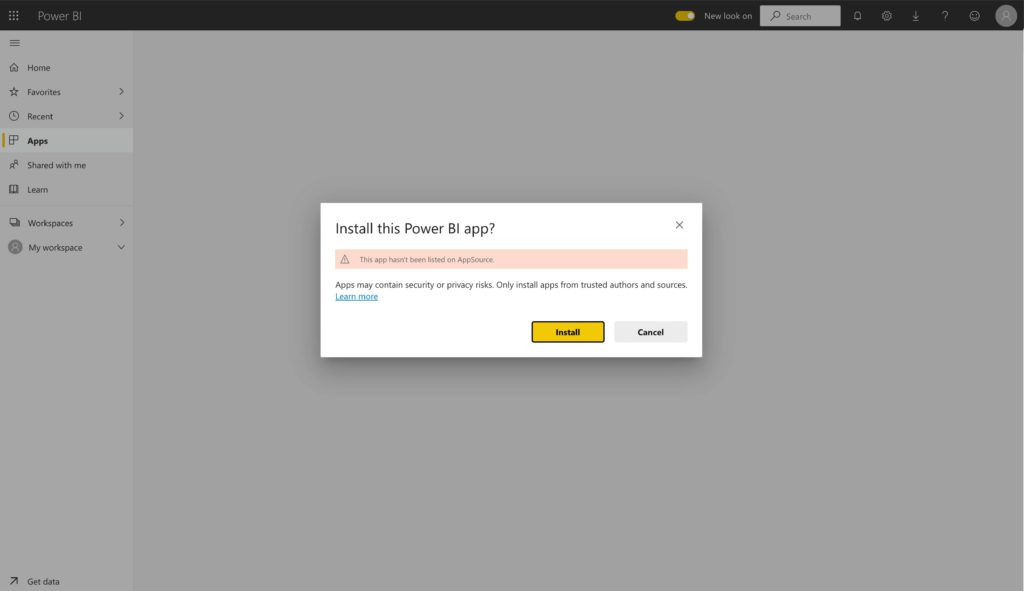
You will be prompted to install the application from an unknown source, simply click on OK.
When you download the application, you can select whether to connect to your data, or explore the app with sample data. You can always go back and connect to your own data after you explore the sample data.

To connect your data by providing a valid URL as well an authentication method.
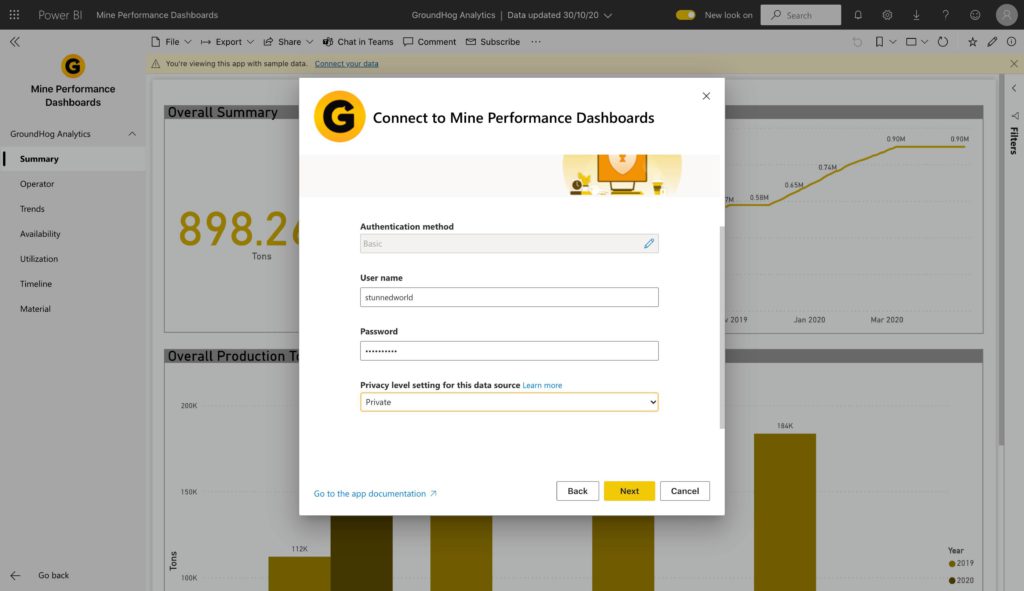
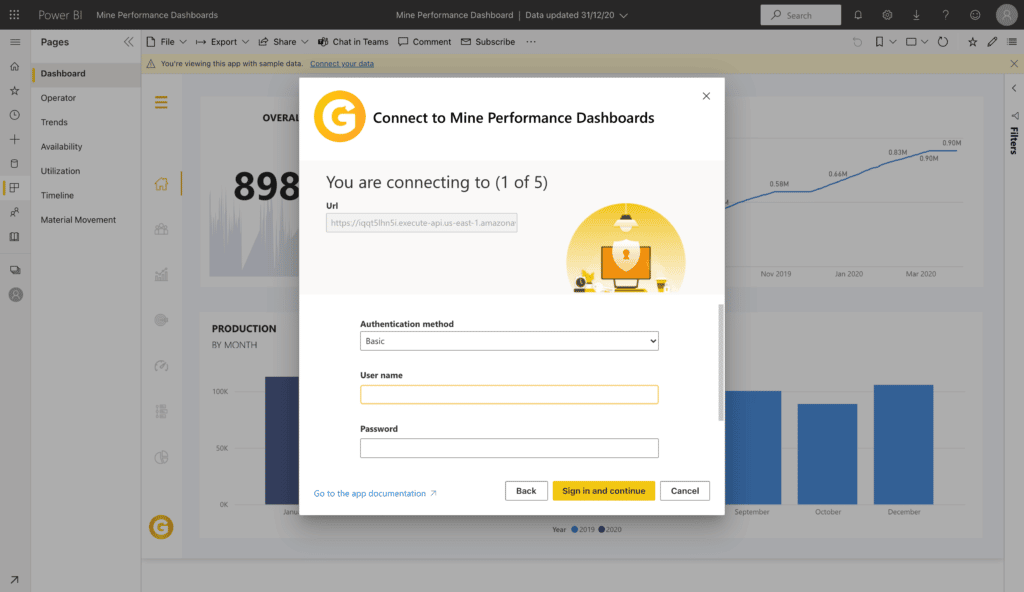
Now you can view and manipulate your data using Power BI.
The template app provides eight tabs to help analyse and share your information:
- Dashboard
- Operator
- Trends
- Availability
- Utilization
- Timeline
- Material
The Dashboard tab helps you to view the quarterly and overall production tonnage at the site as well as the cumulative tons of ore by date.

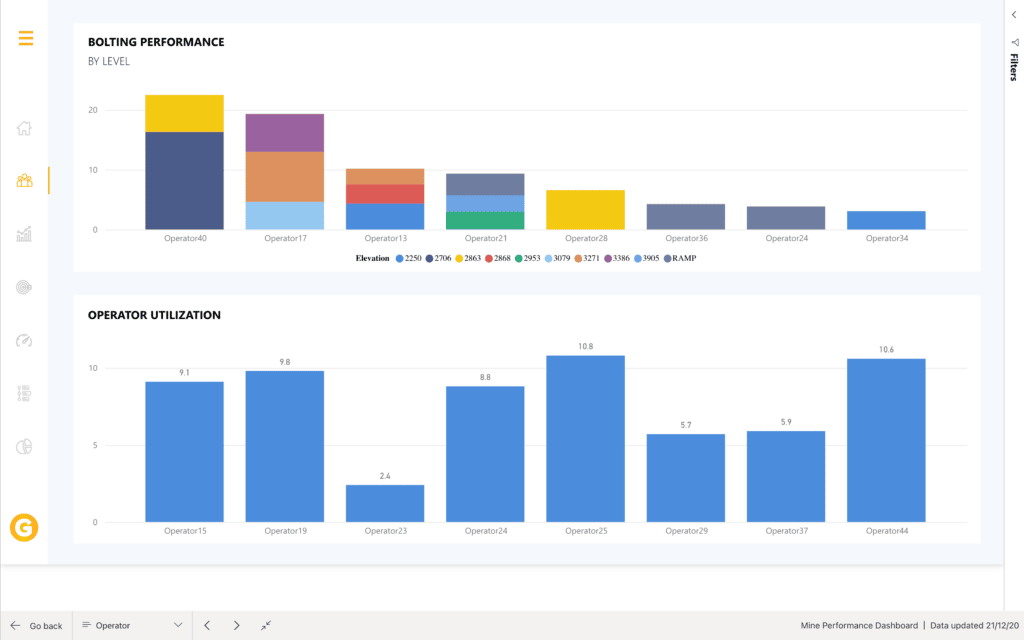
The Operator tab, allows you to get more detailed information about individuals in the mine. This includes minute per bolt by operator and elevation, active shift lengths and overall operator utilization.
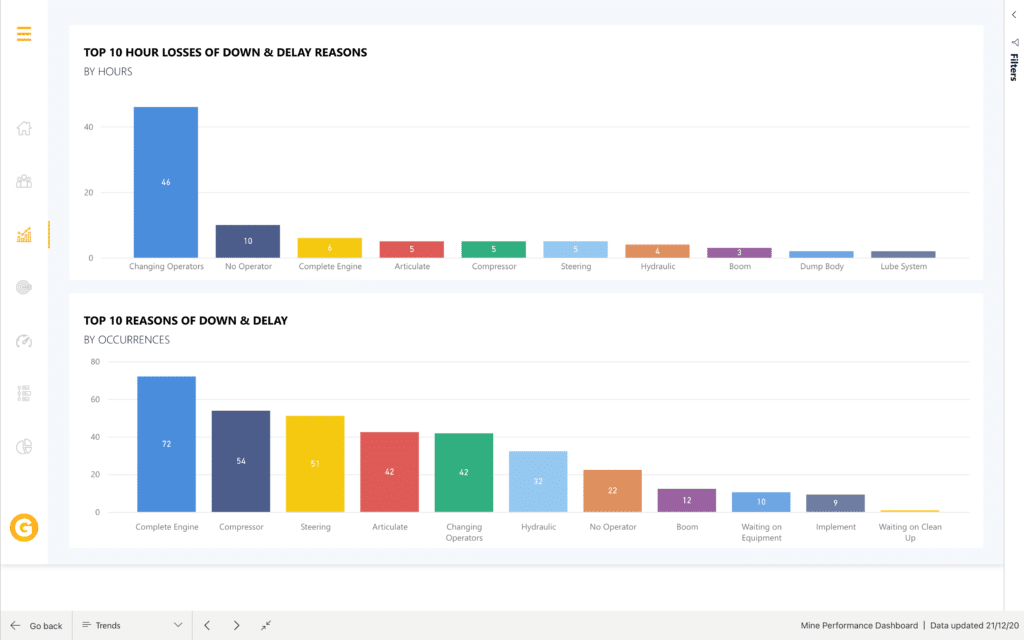
The Trends tab, helps you to better understand overall data trends within the mine. This includes most common delay and down reasons as well as the highest losses resulting from downs and delays.
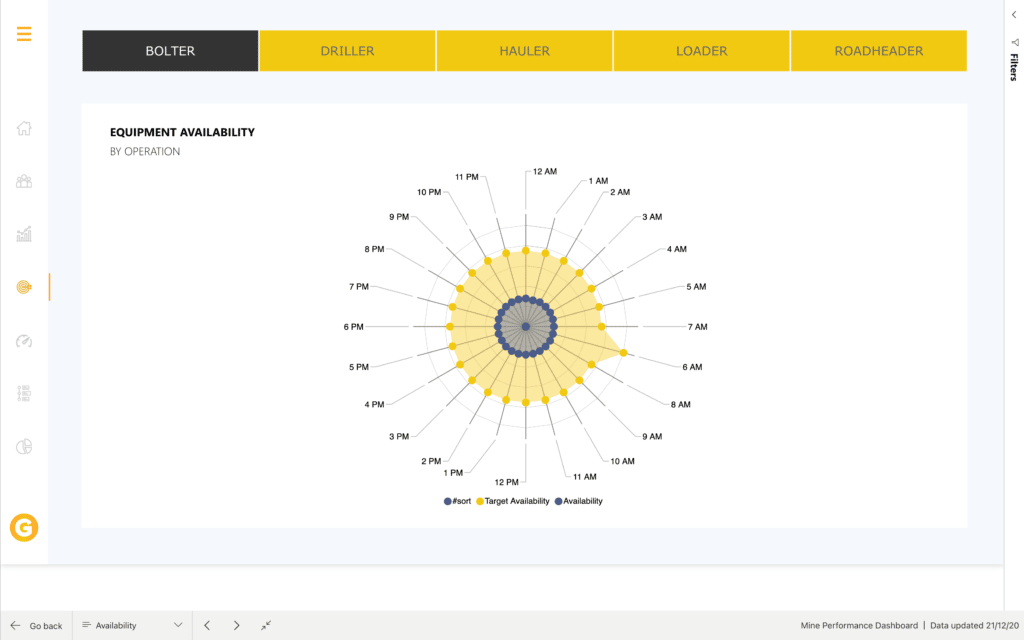
With the Availability tab, you can easily compare the actual availability of equipment with the expected availability to enhance planning capabilities.
The Utilization tab, allows you to be able to access visualizations of actual utilizations of equipment as well as expected utilization.
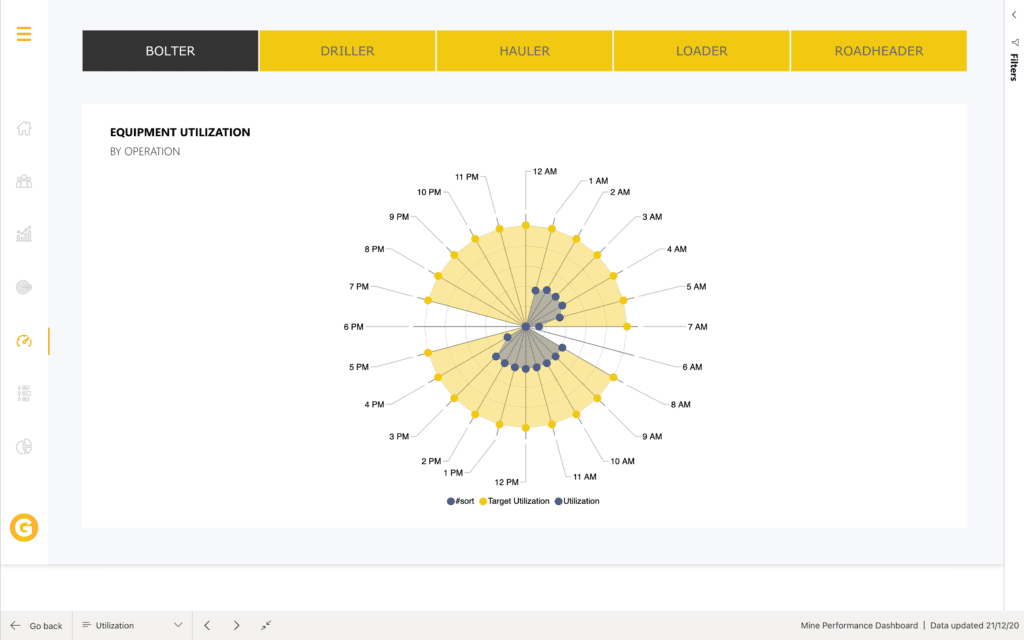
The Timeline tab, allows you to see a chronological overview of the equipment states throughout the day.
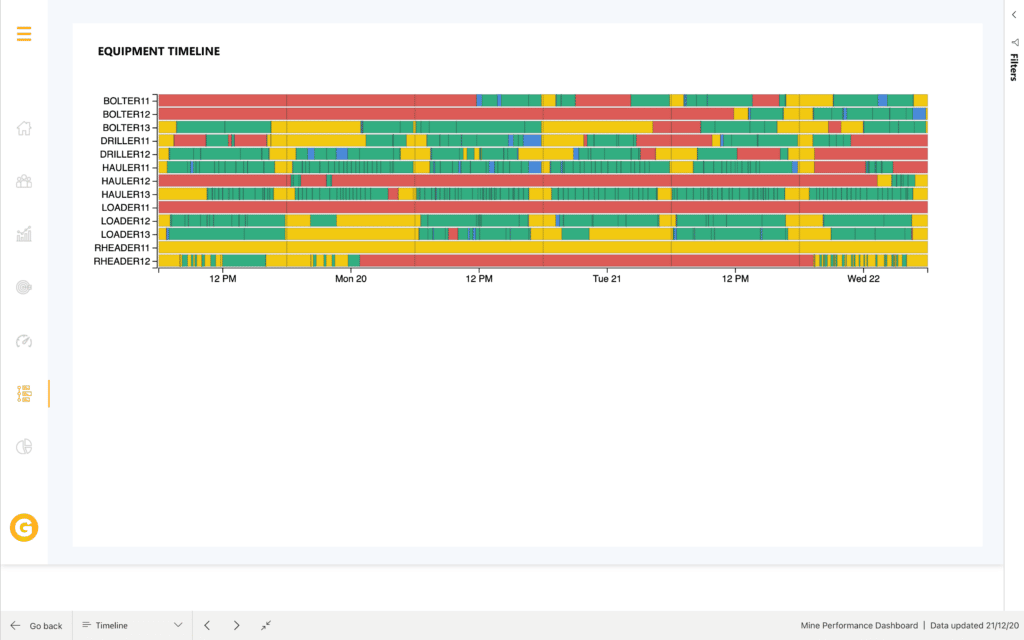
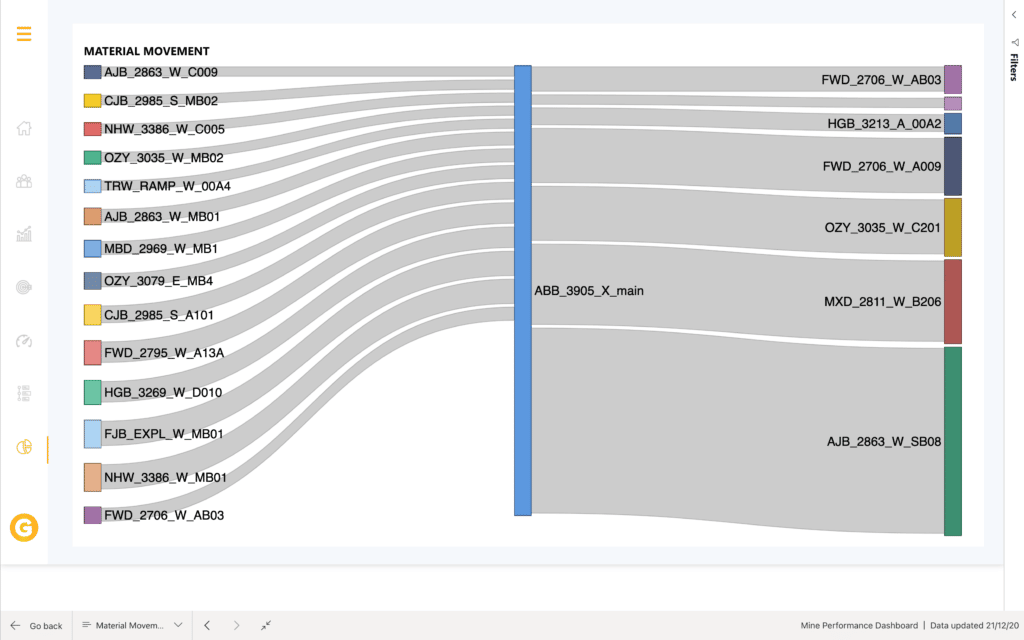
The Material tab, helps you to view a breakdown of the types and quantities of materials being hauled each day.
Getting help
If you run into problems when connecting to your data, you can Mine Performance Dashboard support at
Next steps
There are all sorts of data you can connect to using Power BI Desktop. For more information on data sources, check out the following resources:
- What is Power BI Desktop?
- Data Sources in Power BI Desktop
- Shape and Combine Data with Power BI Desktop
- Connect to Excel workbooks in Power BI Desktop
- Enter data directly into Power BI Desktop


