Using PowerBI Desktop, you can connect to GroundHog analytics, making visualization of data from the mine simple.
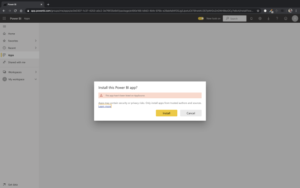
To begin with, you’ll need to search for GroundHog Analytics on the PowerBI app store and install it. You’ll be prompted to install an app from an unknown source, simply click ok and you’ll be ready to go.
After that, you should see a “get started with your new app screen”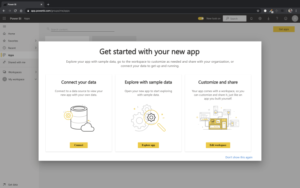
You’ll then need to connect your data by providing a valid URL as well an authentication method.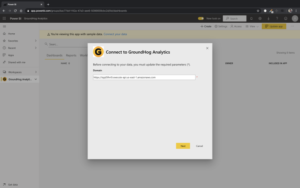
Now you can view and manipulate your data using PowerBI.
Using the summary tab you’ll be able to view the quarterly and overall production tonnage at the site as well as the cumulative tons of ore by date.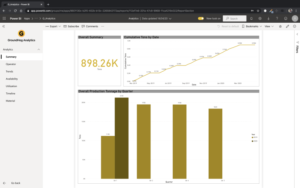
From the operator tab, you can get more detailed information about individuals in the mine. This includes minute per bolt by operator and elevation, active shift lengths and overall operator utilization.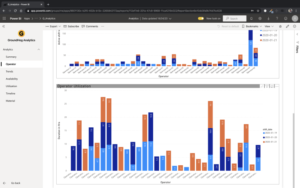
With the trends tab, you’ll be able to better understand overall data trends within the mine. This includes most common delay and down reasons as well as the highest losses resulting from downs and delays.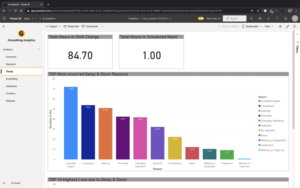
Using the availability tab, you can easily compare the actual availability of equipment with the expected availability to enhance planning capabilities.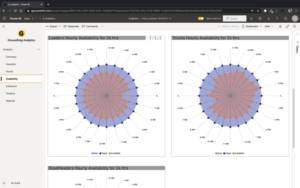
From the utilization tab, you’ll be able to access visualizations of actual utilizations of equipment as well as expected utilization.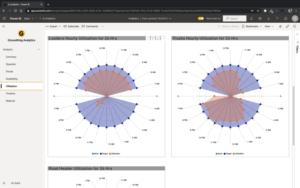
With the timeline tab, you’ll be able to see a chronological overview of the equipment states throughout the day.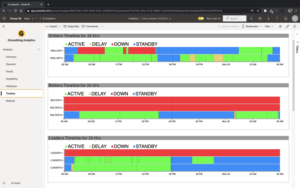
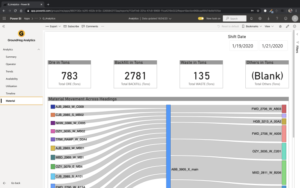
Using the material tab, you’ll be able to view a breakdown of the types and quantities of materials being hauled each day.