First off, what is Minestar
Minestar Reporting is part of is Caterpillar’s Minestar Fleet Management system, and is primarily used by large open pit mines to improve overall productivity and safety. It is a comprehensive suite of tools, including fleet management, machine health monitoring, and guidance technology.
Most large mines that have a large fleet (typically more than 30 pieces of equipment) use a Fleet Management System (Modular, Wenco and GroundHog are FMSes) to improve the overall utilization of their equipment – especially of the load-haul fleet and of the drill fleet. Systems like Minestar help these large mines meet the mill’s feed grade requirements at a given feed rate effectively and efficiently.
Systems like Minestar are pretty powerful and require quite a lot of custom hardware and software to be installed and configured – especially High precision GPS units, haul routes, hopper and stockpile locations, “decision points”, etc.
The installation is typically done on-premises, on pretty powerful servers running an enterprise class database such as SQL Server. There is typically also a dispatch team that works 24×7, and also a couple of full-time Minestar administrators to debug issues, update configs, and manage and validate data, etc.
How do you analyze Minestar data
Like I said earlier, Minestar has a few modules; and each module generates a set of standard reports that cover more than 80% of what a mine typically needs. For example, the Fleet module has standard reports such as trip counts, material movement, haulage analytics, load time analytics, queueing patterns, fuel consumption analytics, etc.
Other modules such as Terrain and Safety have their own reports.
More recently, Caterpillar came out with the Caterpillar reporting module that allows administrators to create reports using data across all modules.
My takeaway after having worked with it is that it is fairly good for tool built by a mining equipment OEM. That said, it does not have all the bells and whistles of an Enterprise Class, general purpose reporting software. There is very limited integrations with other 3rd party tools – such as being able to import data from Epiroc’s Certiq or or Sandvik’s FDM. Folks that are going to use the reporting module need specific training on Minestar reporting. And it is not the most user-friendly interface to work with. Most importantly, there isn’t much support (well, you can always pay an arm-and-a-leg to get the support you want). And to be honest, it is hard to find somebody that already has experience with Minestar reporting.
What is PowerBI?
Power BI is the #1 cloud-based business analytics platform – by Microsoft – that provides a single view of your most critical business data. And it seamlessly integrates with most of the other software you use at your mine site — including SQL Server, MS Access and Excel — and the license is also pretty cheap. With Power BI, you can easily create interactive dashboards and reports that can be accessed from anywhere, on any device. This makes it easy to keep track of your business’s key performance indicators (KPIs), identify trends, and make data-driven decisions quickly.
Why you should use PowerBI to analyze Minestar data
Minstar has done a really good job with documenting their schema – and it does not change frequently. Therefore, we strongly recommend using an Enterprise class Business Intelligence and Reporting package like PowerBI (or Tableau) to analyze your Minestar data. Reporting software like PowerBI has become increasingly popular in the mining industry in recent years, thanks to its user-friendly interface and powerful data visualization capabilities.
PowerBI is known for its powerful data visualization capabilities. It allows Continuous Improvement engineers, and even tech-savvy Shift Bosses to create interactive visualizations that help them understand their fleet data in new ways
PowerBI is also designed to work with data of all sizes, from small data sets to large enterprise data warehouses. PowerBI is part of the Microsoft ecosystem, which means that it integrates seamlessly with other Microsoft tools, such as Excel and SharePoint. Every mining engineer worth their salt likes to export data and reports into Excel and do additional analysis to find new ways to eke out more performance and efficiency from their equipment and personnel.
In the remainder of this post, I’ll show you how to connect PowerBI to your Minestar data. Please know that you might need to work with your Minestar admin to get access to the SQL Server, and to the schema. Most admins are more than happy to provide read-only access to the Minestar data so you can run additional reporting and analytics.
Minestar Database Schema
Minestar does a really good job of publishing their schema. Minestar Reporting also uses the same schema. If you dont have access to their schema or want help in understanding the schema, please do not hesitate to contact me at satish.penmetsa@groundhogapps.com.
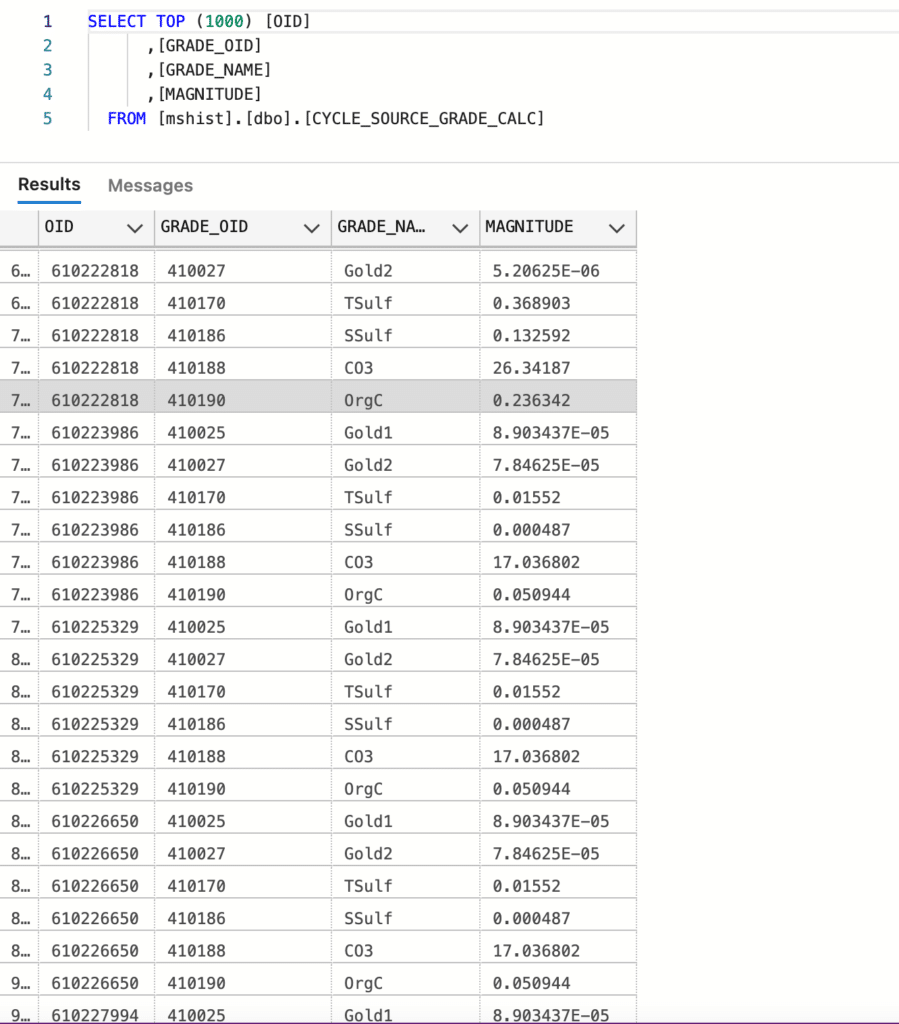
Here are a few examples of queries we run against the Minestar database for Minestar Reporting.
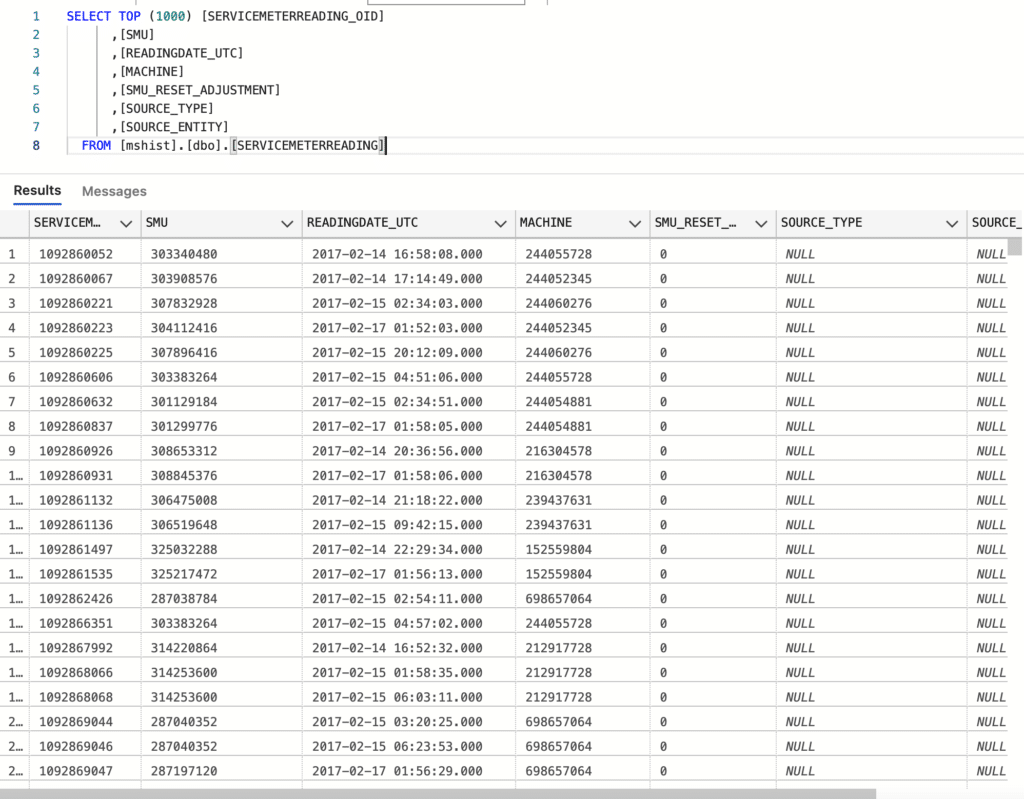
And here is an example of the SMU Hours (Hour Meter Readings)
Connect to the Minestar Database
First off, you’ll need the connection strings — i.e. you’ll need to get the name of the Minestar SQL Server Database. You can get it from your Minestar admin or from your IT. In this example, the Minestar SQL Server database server name is MNSTRPROD41. Minestar Reporting will be connected to the same database.
Then, use the Microsoft Azure Data Studio to connect to the SQL Server Database. Again, if you need help, please do not hesitate to reach out contact me at satish.penmetsa@groundhogapps.com.
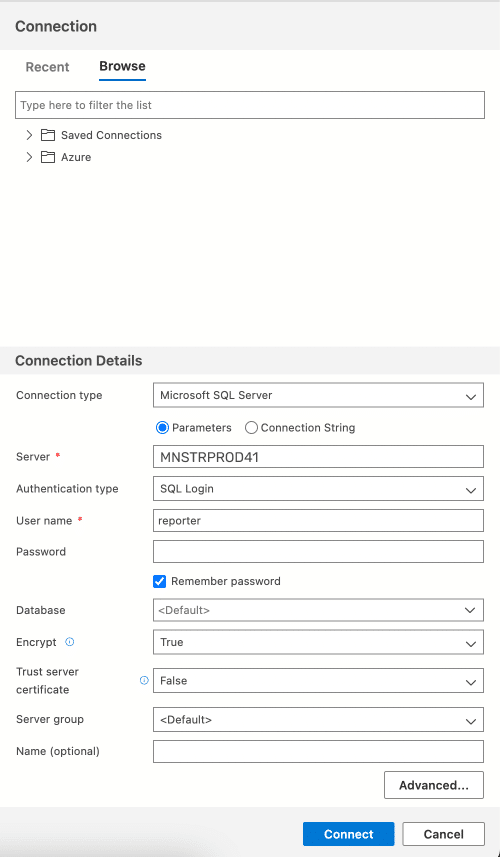
Once you connect to the database, you can explore the data schema.
Connect PowerBI to the Minestar Database
To connect PowerBI to the Minestar database, you’ll first need to use PowerBI Designer. Power BI Designer allows you to create interactive visualizations and business intelligence reports. It is part of the Power BI suite of tools, and is used for data modeling, analysis, and visualization. Power BI Designer lets you connect to a wide range of data sources, including databases, cloud services, and Excel spreadsheets. It has a pretty powerful drag-and-drop interface for building visualizations, and it includes a library of pre-built charts, tables, and other graphical elements. Users can also create custom calculations and measures using a formula language called DAX (Data Analysis Expressions), and they can use Power Query to transform and clean data before analysis – you’ll need this to transform some of the data in the Minestar database to calculate KPIs.
They way you connect is the following
Open PowerBI Designer and download the GroundHog PowerBI Executive Dashboard app for Mine Managers
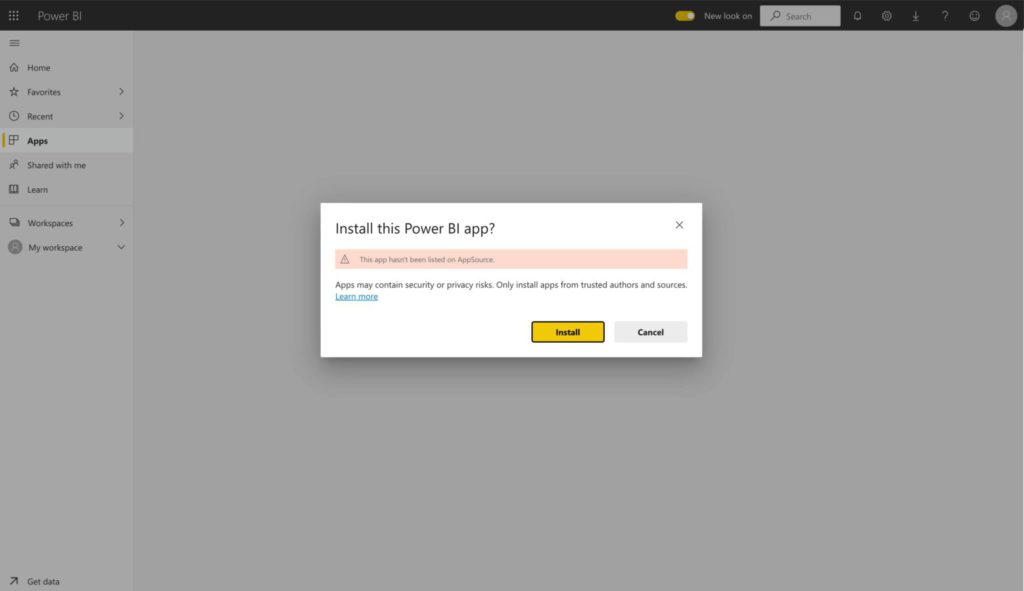
Download the GroundHog PowerBI Executive Dashboards app from the PowerBI App store
You will be prompted to install the application from an unknown source, simply click on OK.
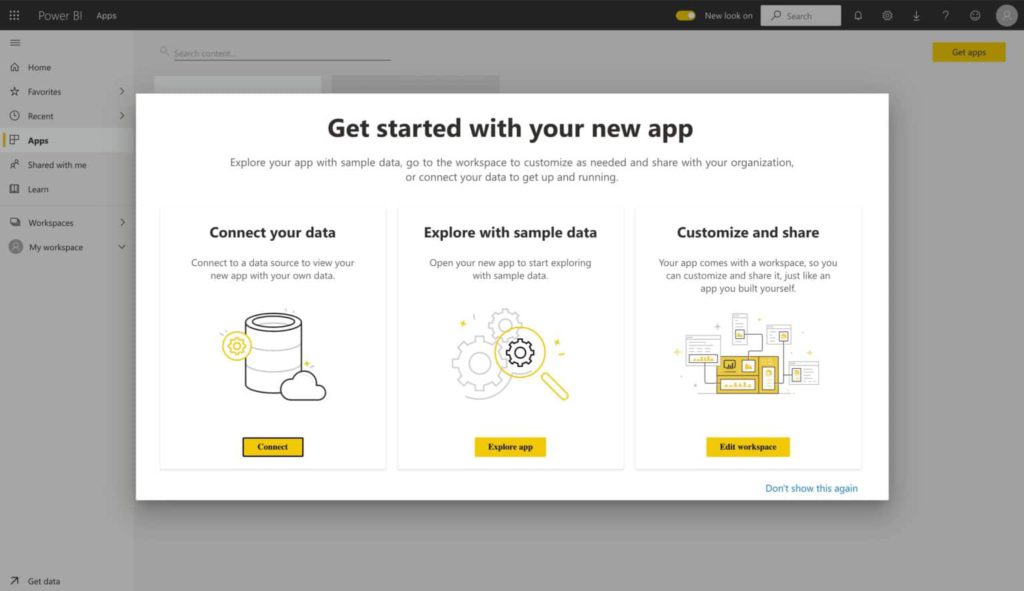
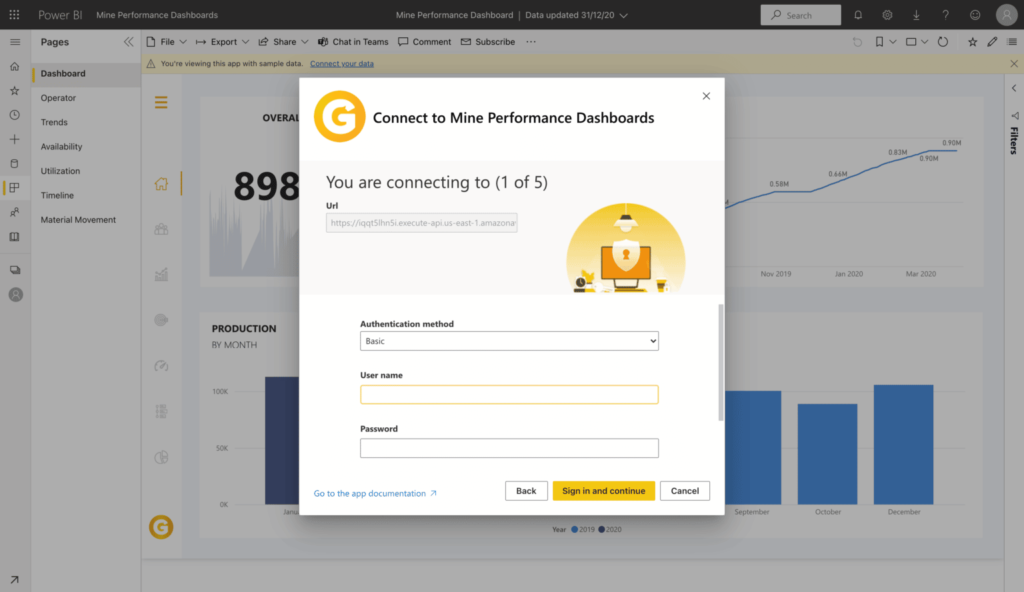
When you download the application, you can select whether to connect to your data, or explore the app with sample data. You can always go back and connect to your own data after you explore the sample data. Here, you’ll need to connect to the Minestar database using the connection strings you got from your Minestar administrator, or from your IT.
Enter the connection strings
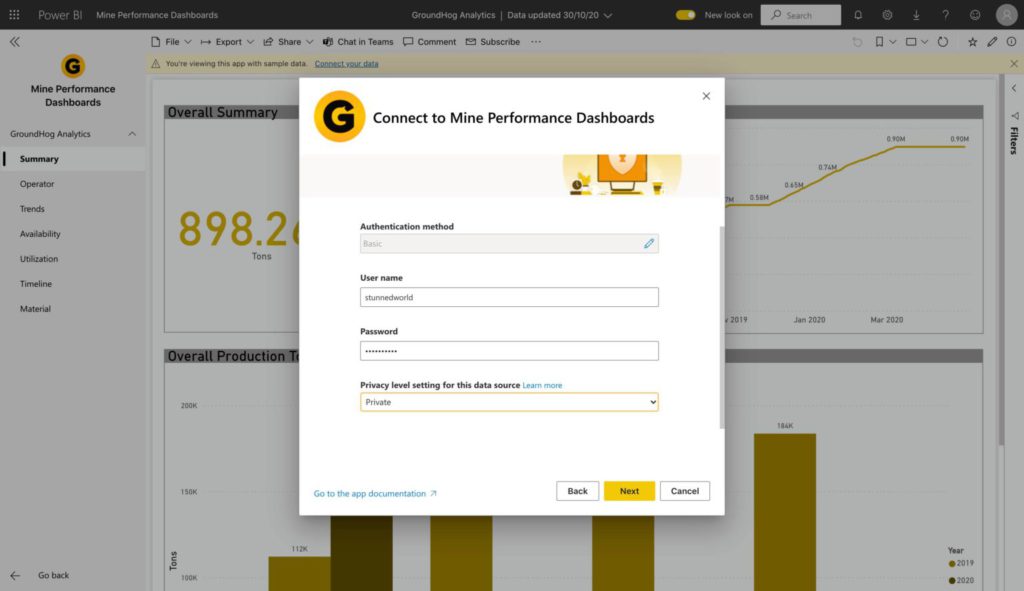
Enter the database name, username and password.
Complete the connection process, and you are ready to go
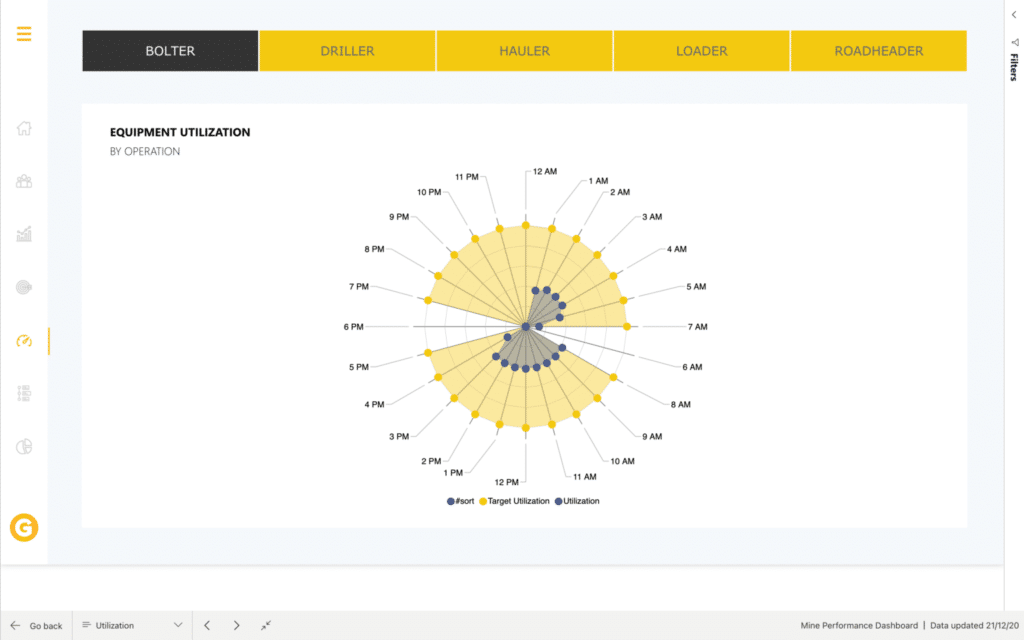
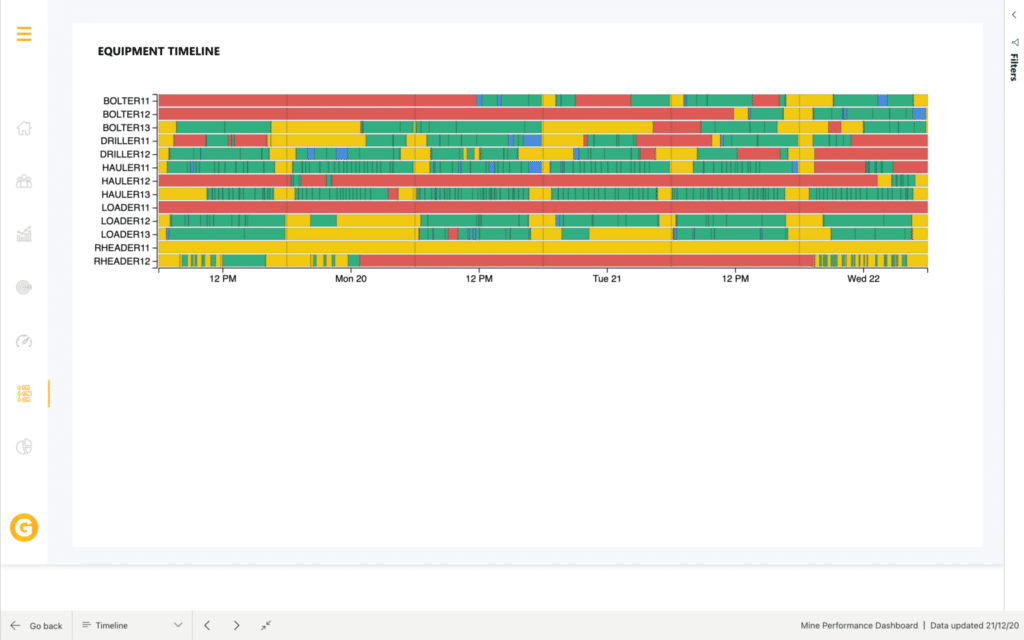
A few sample out-of-the-box PowerBI Minestar Reporting reports
Once you’ve configured PowerBI to connect to your Minestar database, you can generate more advanced reports and visualizations than what you can get with Minestar reporting. The examples I show you here are mostly for availability and utilization – but you could build reports for your load/haul analytics, operator effectiveness, etc. You are only limited by your imagination going forward!!!
Conclusion: Use PowerBI to analyze your Minestar data
PowerBI is the most powerful reporting and business analytics platform available today. And it is quite easy to connect PowerBI to Minestar data. We strongly recommend you switch over from Minestar Reporting to PowerBI — why pay additional licenses to Caterpillar? And why provide separate training to your personnel on how to use Minestar reporting? Standardize on PowerBI.
If you have any trouble connecting your PowerBI instance to Minestar, or need any other kinda help, please message me on LinkedIn, or e-mail me at satish.penmetsa@groundhogapps.com or call us at +1.888.719.3282 to schedule a FREE consulting session.